
Washington State University scientists have developed a new way to classify the ocean’s diverse environments, shedding new light on how marine biomes are defined and changed by nature and humans.
Newly published in Global Ecology and Biogeography, research by Alli Cramer, a 2020 doctoral graduate of WSU’s School of the Environment, now at the University of California-Santa Cruz, and WSU Professor Stephen Katz revealed a new approach which sorts biomes based on their life-supporting potential and stability of the sea floor.
Seeking patterns in the data
Cramer and Katz reviewed more than 130 studies to weigh variables such as light, depth, and nutrients across seven biomes incorporating dozens of environments, including coral reefs, kelp beds, ocean ice, and deep abyssal plains.

Analyzing the data inductively, rather than proceeding from an initial hypothesis, they found biomes were most clearly sorted by two strong variables: gross primary production, a measure of the energy in the food web; and substrate mobility, or the movement and composition of the ocean floor.
“This means that energy flow and mobility are common organizing forces across a wide variety of marine ecosystems,” Cramer said. “Despite their differences, coral reefs and deep-sea deserts respond to the same processes.”
Energy of life, movement of the seafloor
While biomes on land have long been defined by climate, marine biomes have evaded clear categorization.

“The oceans are a big black box,” Katz said. “Scientists have traditionally seen depth, temperature, and light as important. But we found that they don’t capture every community. The sea’s energy economy runs in other ways than just sunlight.”
As a doctoral student, Cramer set about developing a more effective way to sort out marine biomes.
After analyzing many variables, “there were really only two that end up revealing the big pattern,” Katz said.
Gross primary production measures the energy flowing through a marine community—whether fueled by sunlight, the recycled ‘brown food web’ of the deeps, or chemicals flowing from hydrothermal vents. Coral reefs, sea ice, and mangrove swamps have high primary production, while the deep, muddy abyssal plains are marine deserts of low productivity.
The other strong variable, substrate mobility, sorted biomes on the nature of their bottom layer—what it is made of, and how much it is moved and stirred by waves and currents. A sandy bottom that’s mostly stable defines a different biome from one that’s constantly in motion.
“These two axes are important forces in determining the ecosystems in the ocean, and driving their formation,” Katz said,
“One of the things that’s novel about this classification system is that it’s simple— so simple that nobody bothered,” he added. “When we told our colleagues about this, they were surprised that no one had tried it before.”
The new method could help scientists, fisheries managers, and conservationists reconsider the richness and diversity of ocean biomes, as well as the value of high productivity regions being impacted by humans.
“Previous work has looked at the marine environment on an ecosystem-by-ecosystem basis,” Cramer said. “By combining data from many ecosystems, we found the common thread that binds them together. This lets us see the ocean in new ways, and highlights some key places where our actions may alter ecosystem function.”
Read the paper, “Primary production and habitat stability organize marine communities,” online.
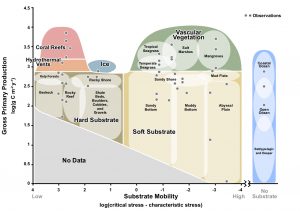
Graphic: Gross Primary Production and Substrate Mobility
This figure describes the pattern of global ocean biome types, mapped in a bivariate classification of energy flow versus substrate mobility.
The vertical y-axis shows energy flow ranging from 0 to 4.5, measured as the log of gross primary production (GPP) in grams of carbon per meter squared per year.
The horizontal x-axis shows substrate mobility ranging from 4 to -4, measured as the log of the difference between median yearly bed stress and critical stress (in Pascals) for grain sizes within marine communities. Low mobility substrates (on the left) have high values (positive) while the most mobile substrate is on the far right with a value of “No Substrate” as there is no consistent substrate for the Open Ocean.
The map contains 46 individual data points, each representing a single GPP observation and the average substrate mobility for grain sizes at the GPP sample site. Boundaries indicate the scope of possible observations for a single community type. Specific values from the literature are points, boundaries identify communities within biomes, while different colors identify biomes. As with similar exercises with terrestrial biomes, the boundaries are approximate.
The overall pattern shows grouping of data points from the same biomes with sorting between communities and biomes types. Marine biomes, such as coral reefs, hydrothermal vents, and soft substrates, are differentiated based on these axes. Communities within those biomes, such as soft substrate muddy bottoms and sandy beaches, sort within their biomes.
Highly productive systems such as coral reefs and salt marshes are at the top while low productive systems like the abyssal plain are on the bottom. Hard, low mobility substrates are on the left, distinct from highly mobile substrates such as sand or the constantly moving open ocean on the far right.